The PIE System was created for the Department of Children and Families (DCF) in Connecticut. It helps providers track the care of individuals and report on service outcomes for state reporting requirements, as well as grant-writing purposes. PIE further allows DCF to aggregate the data and report on Quality of Life outcomes across the state.
PIE collects data from the initial referral stage through the end of an episode of care. The system allows for a variety of Data element types that include String (free-text), Date and Time, Select One dropdowns and radio buttons, Select All That Apply lists with checkboxes, Integer fields (positive, negative and zero), and Number fields (allowing for decimals).
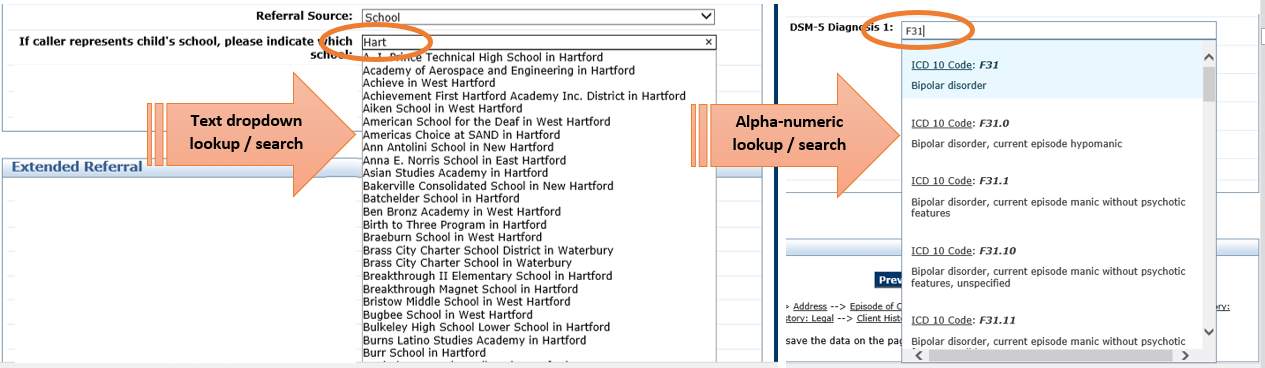
Smart Auto-Complete Lookup Dropdowns
Auto-complete dropdowns allow for a Select One data element type with the flexibility of a huge amount of response options from which to choose. It can be as simple as a text lookup, like the School list example below. It can be comprised of more complex alpha-numeric response options, like the DSM Diagnosis control example below.
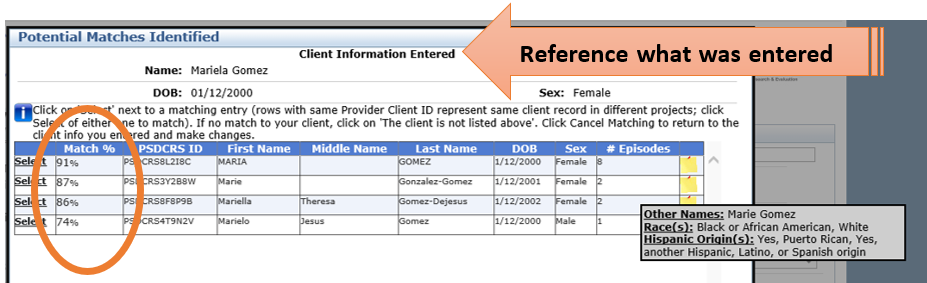
Phonetic component in matching algorithm to reduce duplication
As users add new clients, the system searches the database for potential duplicates. It uses a phonetic component, so that matches with a “sounds like” similarity also get pulled into the algorithm. The Potential Matches page itself displays key identifying information to assist user in selecting the correct match, including sticky note flyouts showing additional client-level details, like race, ethnicity and nick names or aliases.
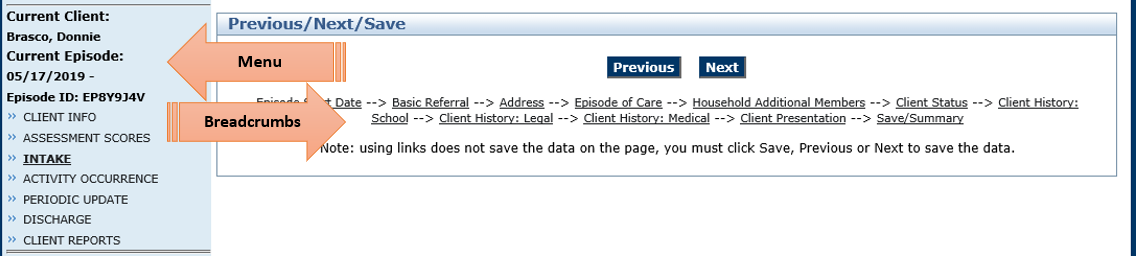
Menus and breadcrumbs for easy navigation
Clickable links throughout the system provide easy navigation. The left-hand menu always displays (so a user can never get lost in the system) and expands to show additional areas as user accesses different levels. Within data entry screens, breadcrumbs display at the bottom, so users can easily jump back and forth between sections of the survey as needed.
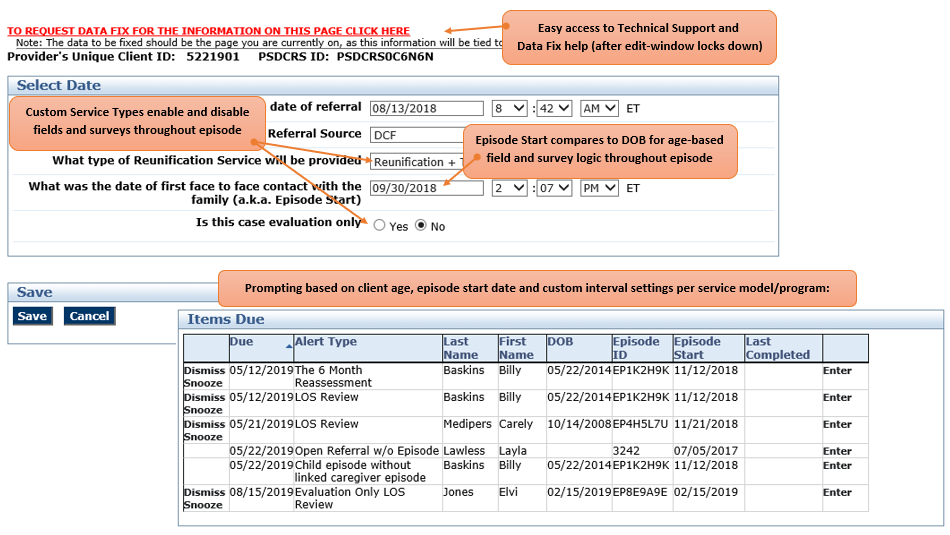
Baseline Intake: Custom conditional logic and survey/assessment prompting
Data entry begins with a “Select Date” page that collects key dates and information, allowing for field-specific conditional logic throughout the episode, as well as survey prompting based on age, service type and other custom needs. Each survey displays a list of unanswered fields at the end, to ensure data completion. Data Fix Request links are available at the top of every data entry page, allowing for easy access to Technical Support and data fix help.
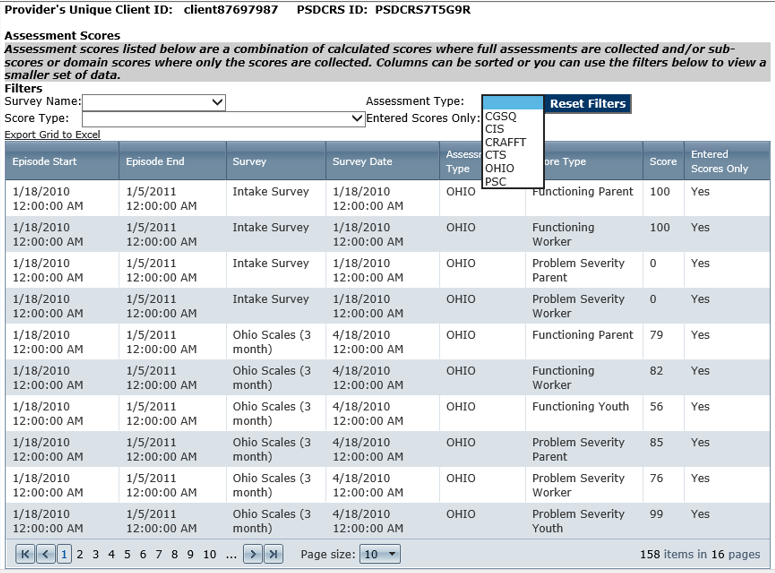
Assessment Scoring
All assessment scores for each client can be viewed collectively. The Assessment scores page groups all baseline, periodic and discharge assessment intervals. User can filter and sort information and then export the data grid for further analysis as needed.
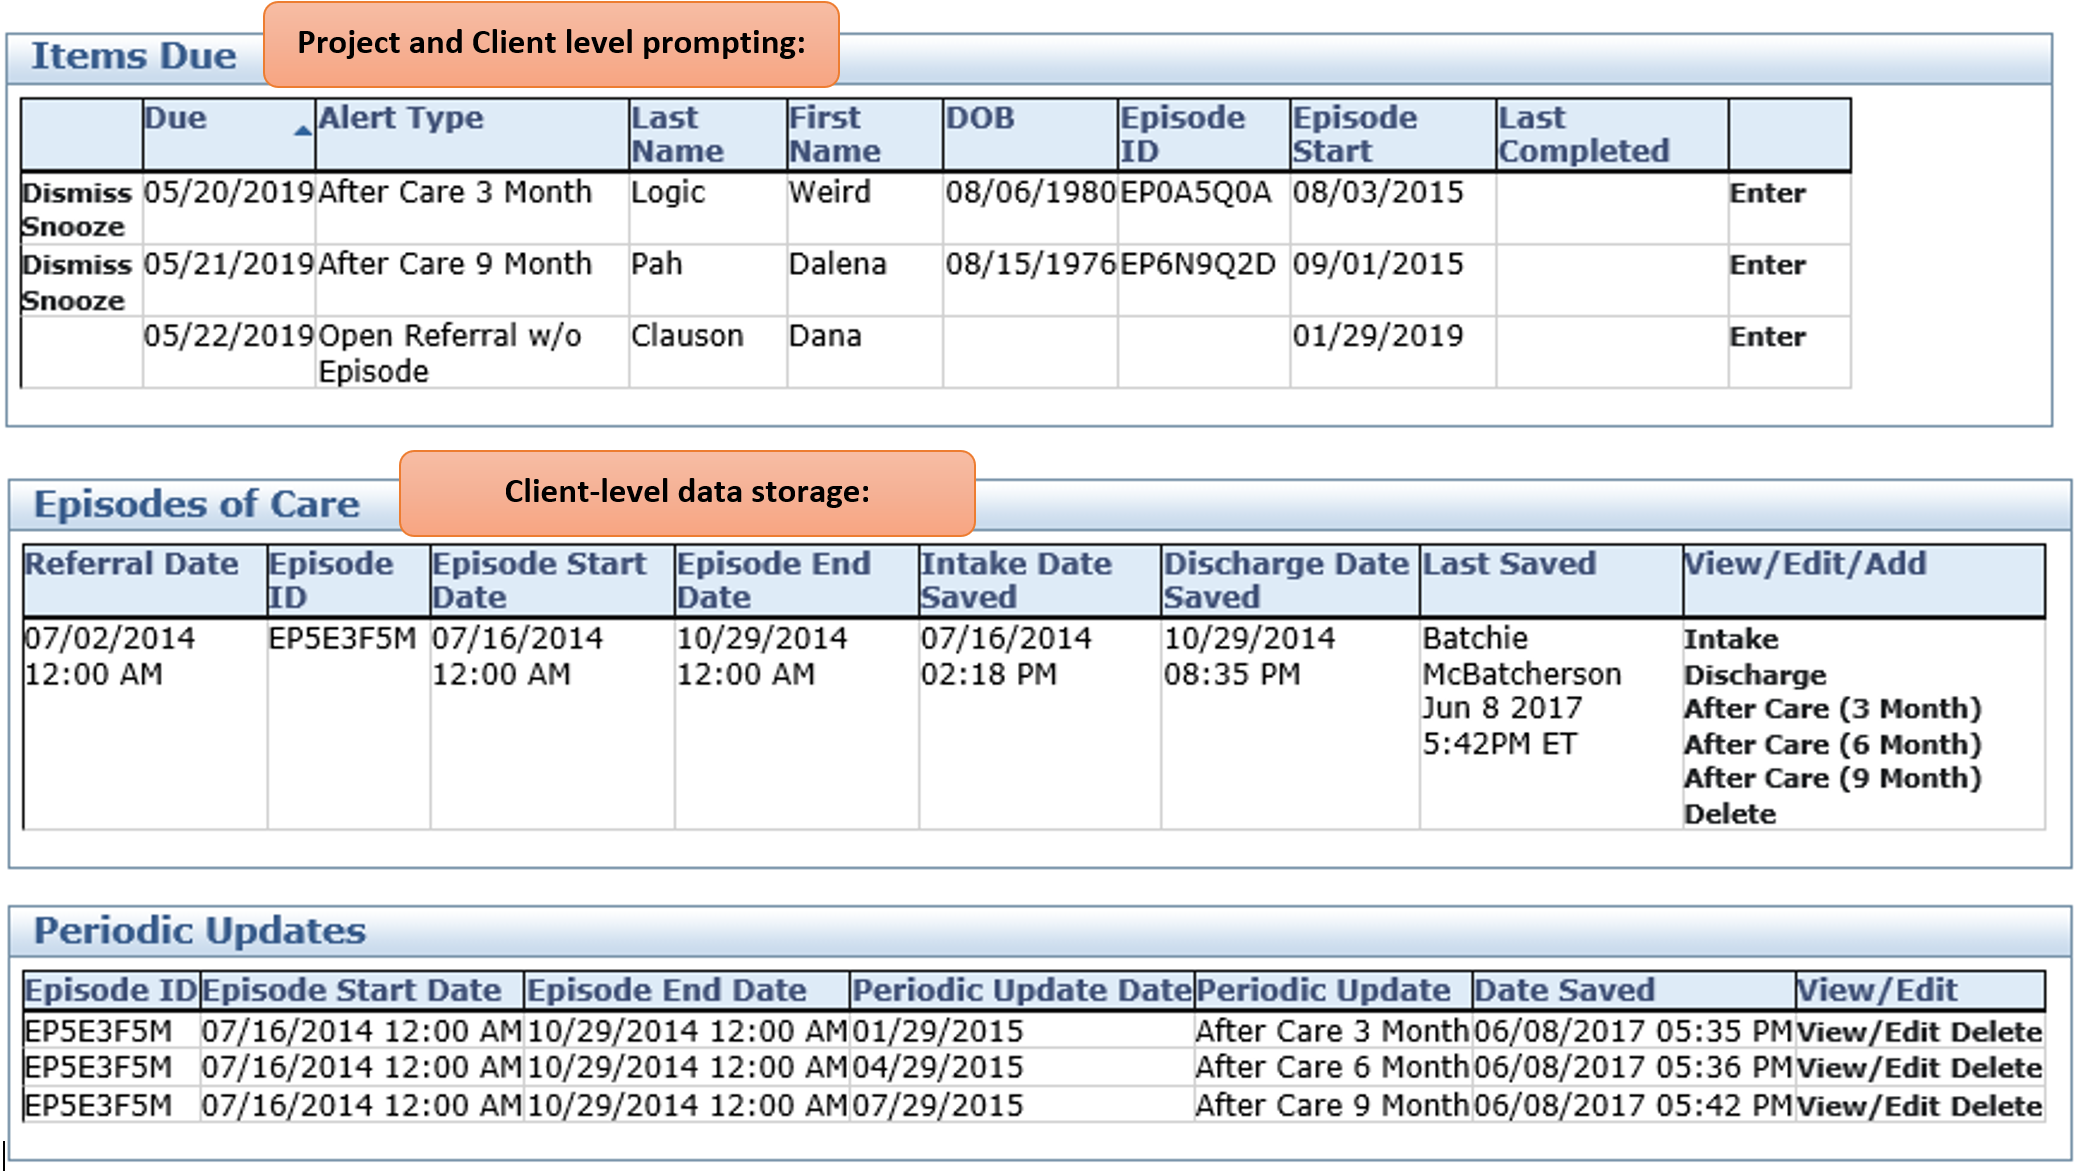
Discharge and After-Care
In addition to collecting discharge data at the end of an episode of care, options for After-Care check-ups can be implemented.
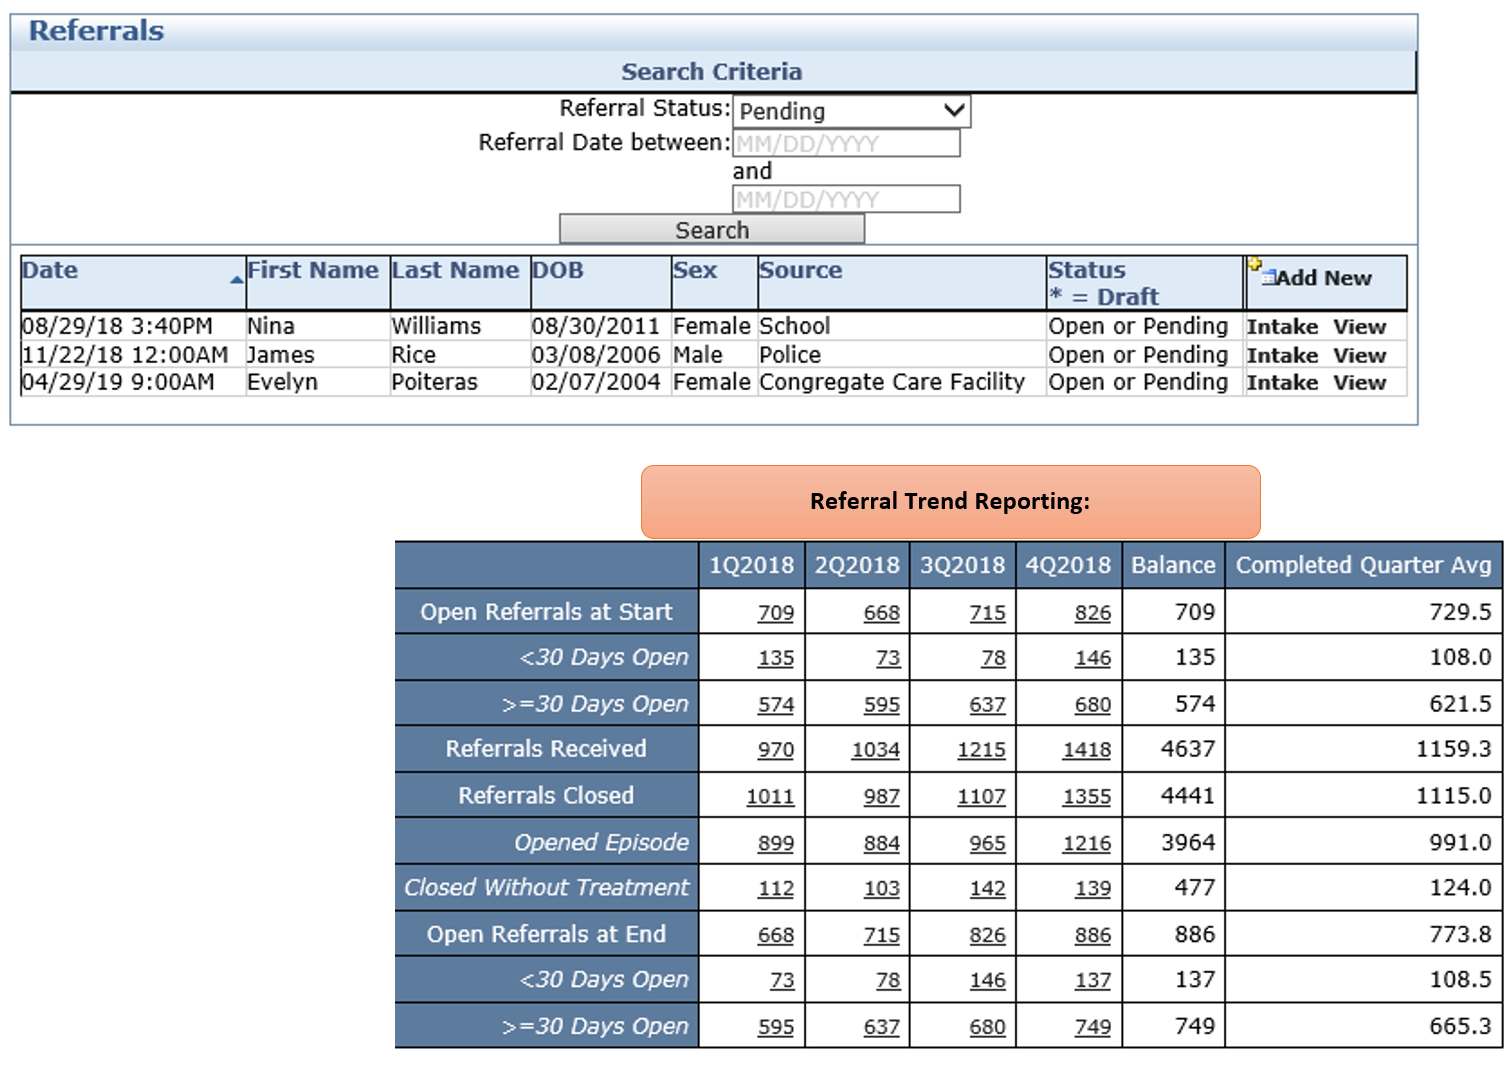
Referrals/Wait List
The Referral/Wait List feature records referrals as they come in to the agency. The Pending Referral queue then serves as a Wait List for the agency. Referrals can be closed out as “Referral Only” if they are never seen face-to-face, or turned into Intakes for clients who are seen face-to-face. Trend reporting shows how long people are waiting for service and how many never receive service at all.
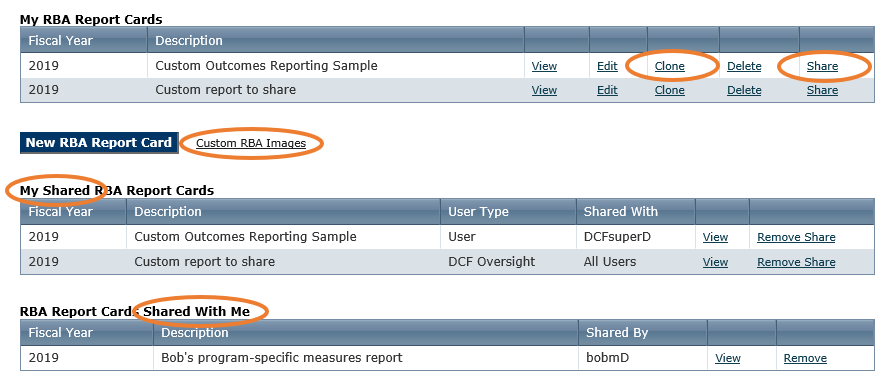
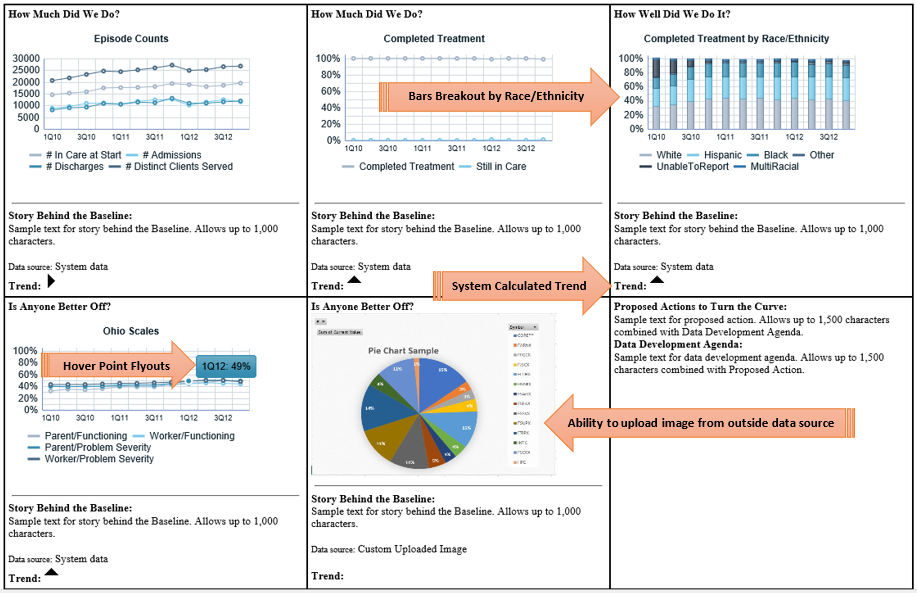
Custom Outcomes Reporting
Custom outcomes reporting allows for measure-specific analysis within specific programs and also across statewide measures. It allows for:
- Sharing of reports between specific users and also entire user-access levels.
- Cloning of reports to make new editable copies.
- Uploading of custom images for reporting out on data collected in another system.
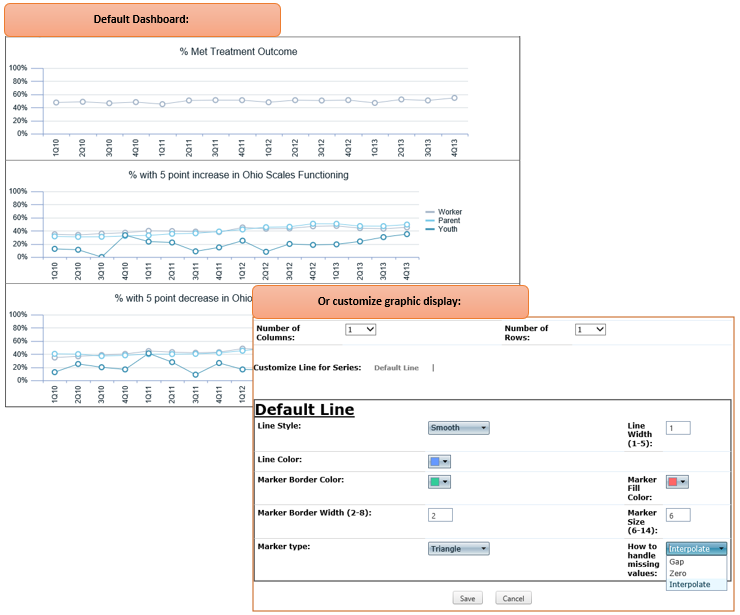
Dashboard
Graphic display of strategic data points can inform and motivate service providers. Dashboards have default settings as well as custom placement and setting options.
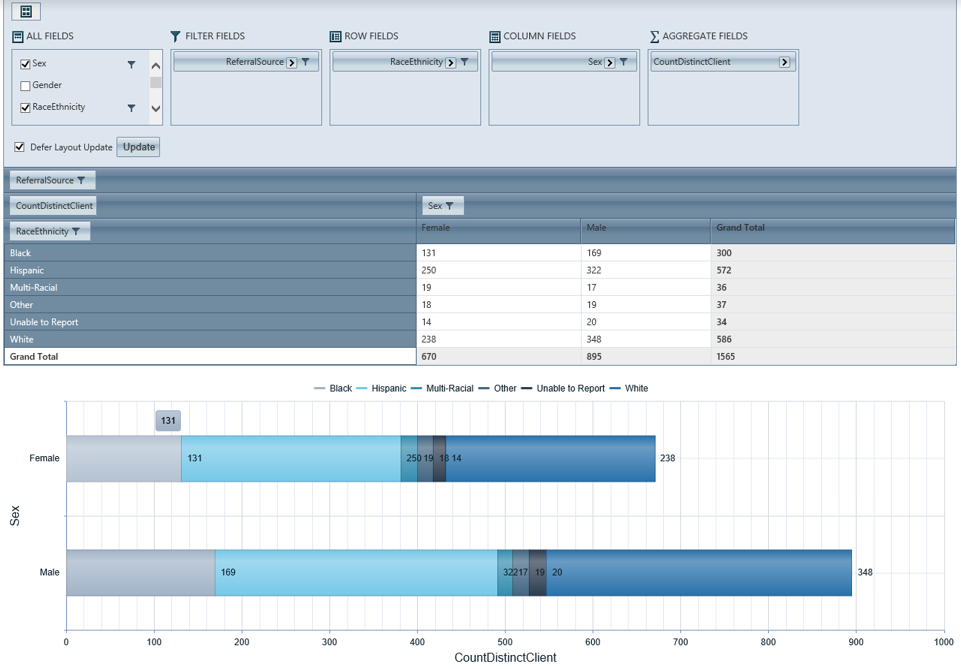
Pivot Reports
Pivot reporting allows for user-specified cross-tabulation and analysis of the data.